
本記事ではChassis Clusterに関する障害時の動作(検証結果)を紹介させて頂きます。
>>参考記事: 「CCIEが語る!ネットワークエンジニアにオススメな本・参考書!」
>>参考記事: 「[まとめ] Juniper/Junosの検証結果を記事にまとめました!」
目次[閉じる]
検証内容

まず最初に検証構成・要件の以下にまとめました。
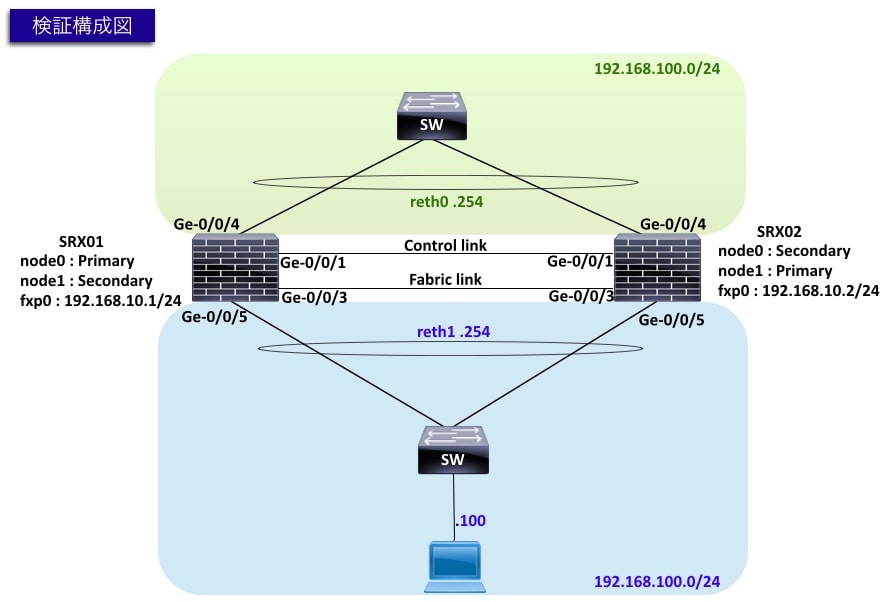
ネットワーク図
検証時のネットワーク環境は以下の通りです。
検証要件
以下の要件に基づきChassis Clusterの障害試験を実施します。
- SRX01[node0] reth1(ge-0/0/5) ケーブル抜線
- SRX01[node0] reth0(ge-0/0/4) ケーブル抜線
- SRX01[node0] fabric link(ge-0/0/3) ケーブル抜線
- SRX01[node0] control link(ge-0/0/1) ケーブル抜線
※各障害試験の結果は「3章:Chassis Cluster 障害試験」にて纏めております。
事前確認 ※飛ばしてOKです。

それでは検証環境の事前設定値を以下にて紹介します。
※本検証前に予めChassis Clusterの設定は実施済みです。
※障害試験の結果のみ気になる方は「3章:Chassis Cluster 障害試験」からご覧ください。
SRX-01 事前ログ
・「show configuration | display set | match」コマンドで設定情報を出力しております。
root@SRX-01> show configuration | display set
// Chassis Cluster関連設定のみ抜粋しました
set groups node0 system host-name SRX01
set groups node0 interfaces fxp0 unit 0 family inet address 192.168.10.1/24
set groups node1 system host-name SRX02
set groups node1 interfaces fxp0 unit 0 family inet address 192.168.10.2/24
set apply-groups "${node}"
set chassis cluster reth-count 2
set chassis cluster redundancy-group 0 node 0 priority 200
set chassis cluster redundancy-group 0 node 1 priority 1
set chassis cluster redundancy-group 1 node 0 priority 200
set chassis cluster redundancy-group 1 node 1 priority 1
set chassis cluster redundancy-group 1 preempt
set chassis cluster redundancy-group 1 interface-monitor ge-0/0/4 weight 255
set chassis cluster redundancy-group 1 interface-monitor ge-0/0/5 weight 255
set chassis cluster redundancy-group 1 interface-monitor ge-3/0/4 weight 255
set chassis cluster redundancy-group 1 interface-monitor ge-3/0/5 weight 255

set security zones security-zone trust interfaces reth1.0
set security zones security-zone untrust interfaces reth0.0
set interfaces ge-0/0/4 gigether-options redundant-parent reth0
set interfaces ge-0/0/5 gigether-options redundant-parent reth1
set interfaces ge-3/0/4 gigether-options redundant-parent reth0
set interfaces ge-3/0/5 gigether-options redundant-parent reth1
set interfaces fab0 fabric-options member-interfaces ge-0/0/3
set interfaces fab1 fabric-options member-interfaces ge-3/0/3
set interfaces reth0 redundant-ether-options redundancy-group 1
set interfaces reth0 unit 0 family inet address 192.168.200.254/24
set interfaces reth1 redundant-ether-options redundancy-group 1
set interfaces reth1 unit 0 family inet address 192.168.100.254/24
また、障害試験前に「show chassis cluster status」コマンドでchassis clusterのステータスを確認しておきましょう!
root@SRX01> show chassis cluster status
Monitor Failure codes:
    CS  Cold Sync monitoring        FL  Fabric Connection monitoring
    GR  GRES monitoring             HW  Hardware monitoring
    IF  Interface monitoring        IP  IP monitoring
    LB  Loopback monitoring         MB  Mbuf monitoring
    NH  Nexthop monitoring          NP  NPC monitoring
    SP  SPU monitoring              SM  Schedule monitoring
    CF  Config Sync monitoring      RE  Relinquish monitoring
    IS  IRQ storm

Cluster ID: 1
Node   Priority Status               Preempt Manual   Monitor-failures

Redundancy group: 0 , Failover count: 1
node0  200      primary              no      no       None
node1  1        secondary            no      no       None

Redundancy group: 1 , Failover count: 1
node0  200      primary              yes     no       None
node1  1        secondary            yes     no       None
※Chassis Clusterの設定方法や正常性確認方法は以下の記事に纏めておりますので、ご興味のある方は是非ご覧ください。
>>参考記事: 「SRX Chassis Cluster の設定方法を紹介」
Chassis Cluster 障害試験

それでは、障害時の動作を確認していきましょう!
今回実施する障害試験の項目は以下の通りです。
- SRX01[node0] reth1(ge-0/0/5) ケーブル抜線
- SRX01[node0] reth0(ge-0/0/4) ケーブル抜線
- SRX01[node0] fabric link(ge-0/0/3) ケーブル抜線
- SRX01[node0] control link(ge-0/0/1) ケーブル抜線
それでは上記①〜④試験について、具体的な検証結果を交えて、紹介します!
Chassis Cluster 障害試験① reth1(ge-0/0/5) ケーブル抜線
まずはSRX01のreth1(ge-0/0/5)のケーブル抜線をします。
以下の通り「show interfaces ge-0/0/5 terse」にて、ge-0/0/5がdownした事を確認しましょう!
test-user@SRX01> show interfaces ge-0/0/5 terse
Interface               Admin Link Proto    Local                 Remote
ge-0/0/5                up    down
ge-0/0/5.0              up    down aenet    --> reth1.0
それではge-0/0/5がdown時のChassis Clusterのステータスを確認しましょう!
「show chassis cluster status」「show chassis cluster interfaces | find Monitoring」「show log jsrpd」コマンドで確認しましょう!
show chassis cluster statusコマンド
以下が実際のログです。
Redundancy groupのnode0がsecondary、node1がprimaryになっている事を確認しましょう!
test-user@SRX01> show chassis cluster status
Monitor Failure codes:
    CS  Cold Sync monitoring        FL  Fabric Connection monitoring
    GR  GRES monitoring             HW  Hardware monitoring
    IF  Interface monitoring        IP  IP monitoring
    LB  Loopback monitoring         MB  Mbuf monitoring
    NH  Nexthop monitoring          NP  NPC monitoring
    SP  SPU monitoring              SM  Schedule monitoring
    CF  Config Sync monitoring      RE  Relinquish monitoring
    IS  IRQ storm

Cluster ID: 1
Node   Priority Status               Preempt Manual   Monitor-failures

Redundancy group: 0 , Failover count: 0
node0  200      primary              no      no       None
node1  1        secondary            no      no       None

Redundancy group: 1 , Failover count: 1
node0  0        secondary            yes     no       IF
node1  1        primary              yes     no       None
show chassis cluster interfaces | find Monitoringコマンド
以下が実際のログです。
ge-0/0/5のステータスがdownしている事を確認しましょう!
test-user@SRX01> show chassis cluster interfaces | find Monitoring
Interface Monitoring:
    Interface         Weight    Status                    Redundancy-group
                                (Physical/Monitored)
    ge-3/0/5          255       Up  /  Up                 1
    ge-3/0/4          255       Up  /  Up                 1
    ge-0/0/5          255       Down  /  Down             1
    ge-0/0/4          255       Up  /  Up                 1
【参考】 show log jsrpd | last 50コマンド
以下が実際のログです。
「show log jsrpdコマンド」にてchassis clusterに関する詳細ログを確認することが可能です。
トラブルシューティング時にも役立つコマンドなので覚えておきましょう!
// SRX-01(node0)側
test-user@SRX01> show log jsrpd | last 50 | no-more
Jan 12 01:17:42 printing fpc_num h1
Jan 12 01:17:42 extracting node_id 0 slot 0
Jan 12 01:17:42 jsrpd_cluster_mode_fab_has_children Local child active 1 remote child active 1
Jan 12 01:17:42 reth1 from  jsrpd_ssam_reth_read reth_rg_id=1

Jan 12 01:17:42 Interface ge-0/0/5 is going down
Jan 12 01:17:42 ge-0/0/5 interface monitored by RG-1 changed state from Up to Down
Jan 12 01:17:42 intf failed, computed-weight 0
Jan 12 01:17:42 LED changed from Green to Amber, reason is Monitored objects are down
Jan 12 01:17:42 setting sysctl for ha led color(Amber)
Jan 12 01:17:42 Current threshold for rg-1 is 0. Setting priority to 0. Failures: interface-monitoring
Jan 12 01:17:42 RG-1 PRIMARY->SECONDARY_HOLD since other node has higher priority of 1
Jan 12 01:17:42 Successfully sent an snmp-trap due to a failover from primary to secondary-hold on RG-1 on cluster 1 node 0. Reason: Monitor failed: IF
Jan 12 01:17:42 updated rg_info for RG-1 with failover-cnt 3 state: secondary-hold into ssam. Result = success, error: 0
Jan 12 01:17:42 Successfully sent an snmp-trap due to a failover from primary to secondary-hold on RG-1 on cluster 1 node 0. Reason: Monitor failed: IF
Jan 12 10:17:42 Changing the primary'ship of RG-1 from node0 to node1
Jan 12 10:17:42 reth0 ifd state changed from node0-primary -> node1-primary for RG-1
Jan 12 10:17:42 reth1 ifd state changed from node0-primary -> node1-primary for RG-1
Jan 12 10:17:42 updating primary-node as node1 for RG-1 into ssam. Previous primary was node0. Result = success, Unknown error: 0
Jan 12 10:17:42 printing fpc_num h0
Jan 12 10:17:42 extracting node_id 0 slot 0
Jan 12 10:17:42 jsrpd_cluster_mode_fab_has_children Local child active 1 remote child active 1
Jan 12 10:17:42 reth0 from  jsrpd_ssam_reth_read reth_rg_id=1

Jan 12 10:17:42 printing fpc_num h1
Jan 12 10:17:42 extracting node_id 0 slot 0
Jan 12 10:17:42 jsrpd_cluster_mode_fab_has_children Local child active 1 remote child active 1
Jan 12 10:17:42 reth1 from  jsrpd_ssam_reth_read reth_rg_id=1

Jan 12 10:17:43 SECONDARY_HOLD->SECONDARY due to back to back failover timer expiry for RG-1
Jan 12 10:17:43 Successfully sent an snmp-trap due to a failover from secondary-hold to secondary on RG-1 on cluster 1 node 0. Reason: Ready to become secondary
Jan 12 10:17:43 updated rg_info for RG-1 with failover-cnt 3 state: secondary into ssam. Result = success, error: 0
Jan 12 10:17:43  jsrpd_jsrxnle_update_remote_status status 1
Jan 12 10:17:43 Successfully sent an snmp-trap due to a failover from secondary-hold to secondary on RG-1 on cluster 1 node 0. Reason: Ready to become secondary
// SRX-02(node1)側
test-user@SRX02> show log jsrpd | last 50 | no-more
Jan 12 01:17:42 printing fpc_num h1
Jan 12 01:17:42 extracting node_id 0 slot 0
Jan 12 01:17:42 jsrpd_cluster_mode_fab_has_children Local child active 1 remote child active 1
Jan 12 01:17:42 reth1 jsrpd not ready

Jan 12 01:17:42 printing fpc_num h1
Jan 12 01:17:42 extracting node_id 0 slot 0
Jan 12 01:17:42 jsrpd_cluster_mode_fab_has_children Local child active 1 remote child active 1
Jan 12 01:17:42 reth1 jsrpd not ready

Jan 12 01:17:42 Interface ge-0/0/5 is going down
Jan 12 01:17:42 ge-0/0/5 interface monitored by RG-1 changed state from Up to Down
Jan 12 01:17:42 Current threshold for rg-1 is 255. Failures: none
Jan 12 01:17:42 entering primary for RG: 1

Jan 12 01:17:42 updated rg_info for RG-1 with failover-cnt 5 state: primary into ssam. Result = success, error: 0
Jan 12 01:17:42 printing fpc_num h0
Jan 12 01:17:42 extracting node_id 0 slot 0
Jan 12 01:17:42 jsrpd_cluster_mode_fab_has_children Local child active 1 remote child active 1
Jan 12 01:17:42 Updating reth0's state from node0-primary to node1-primary
Jan 12 01:17:42 reth0 jsrpd not ready

Jan 12 01:17:42 Current threshold for rg-1 is 255. Failures: none
Jan 12 01:17:42 printing fpc_num h1
Jan 12 01:17:42 extracting node_id 0 slot 0
Jan 12 01:17:42 jsrpd_cluster_mode_fab_has_children Local child active 1 remote child active 1
Jan 12 01:17:42 Updating reth1's state from node0-primary to node1-primary
Jan 12 01:17:42 reth1 jsrpd not ready

Jan 12 01:17:42 Interface ge-0/0/5 is going down
切り戻し作業
それではここからは切り戻し作業「SRX01のreth1(ge-0/0/5)のケーブル結線作業」を実施します。
以下の通り、ケーブル結線後はge-0/0/5のステータスがUPに変わった事を確認しましょう!
test-user@SRX01> show interfaces ge-0/0/5 terse
Interface               Admin Link Proto    Local                 Remote
ge-0/0/5                up    up
ge-0/0/5.0              up    up   aenet    --> reth1.0
切り戻し作業(show chassis cluster status)
また、Redundancy groupのnode0がprimary、node1がsecondaryに戻った事を確認しましょう!
test-user@SRX01> show chassis cluster status
Monitor Failure codes:
    CS  Cold Sync monitoring        FL  Fabric Connection monitoring
    GR  GRES monitoring             HW  Hardware monitoring
    IF  Interface monitoring        IP  IP monitoring
    LB  Loopback monitoring         MB  Mbuf monitoring
    NH  Nexthop monitoring          NP  NPC monitoring
    SP  SPU monitoring              SM  Schedule monitoring
    CF  Config Sync monitoring      RE  Relinquish monitoring
    IS  IRQ storm

Cluster ID: 1
Node   Priority Status               Preempt Manual   Monitor-failures

Redundancy group: 0 , Failover count: 0
node0  200      primary              no      no       None
node1  1        secondary            no      no       None

Redundancy group: 1 , Failover count: 2
node0  200      primary              yes     no       None
node1  1        secondary            yes     no       None
切り戻し作業(show log jsrpd)
参考までに切り戻し時の「show log jsrpdコマンド」の結果を共有します。
// SRX-01(node0)側
test-user@SRX01> show log jsrpd | last 50 | no-more
Jan 12 10:18:58 ge-0/0/5 interface monitored by RG-1 changed state from Down to Up
Jan 12 10:18:58 LED changed from Amber to Green, reason is No failures
Jan 12 10:18:58 setting sysctl for ha led color(Green)
Jan 12 10:18:58 Current threshold for rg-1 is 255. Failures: none
Jan 12 10:18:59 Successfully sent an snmp-trap due to a failover from secondary to primary on RG-1 on cluster 1 node 0. Reason: Remote is in secondary hold
Jan 12 10:18:59 entering primary for RG: 1

Jan 12 10:18:59 updated rg_info for RG-1 with failover-cnt 4 state: primary into ssam. Result = success, error: 0
Jan 12 10:18:59 reth0 ifd state changed from node1-primary -> node0-primary for RG-1
Jan 12 10:18:59 reth1 ifd state changed from node1-primary -> node0-primary for RG-1
Jan 12 10:18:59 updating primary-node as node0 for RG-1 into ssam. Previous primary was node1. Result = success, Unknown error: 0
Jan 12 10:18:59 Successfully sent an snmp-trap due to a failover from secondary to primary on RG-1 on cluster 1 node 0. Reason: Remote is in secondary hold
Jan 12 10:18:59 printing fpc_num h0
Jan 12 10:18:59 extracting node_id 0 slot 0
Jan 12 10:18:59 jsrpd_cluster_mode_fab_has_children Local child active 1 remote child active 1
Jan 12 10:18:59 reth0 from  jsrpd_ssam_reth_read reth_rg_id=1

Jan 12 10:18:59 printing fpc_num h1
Jan 12 10:18:59 extracting node_id 0 slot 0
Jan 12 10:18:59 jsrpd_cluster_mode_fab_has_children Local child active 1 remote child active 1
Jan 12 10:18:59 reth1 from  jsrpd_ssam_reth_read reth_rg_id=1
// SRX-02(node1)側
test-user@SRX02> show log jsrpd | last 50 | no-more

Jan 12 01:18:58 ge-0/0/5 interface monitored by RG-1 changed state from Down to Up
Jan 12 01:18:58 Current threshold for rg-1 is 255. Failures: none
Jan 12 01:18:59 RG-1 PRIMARY->SECONDARY_HOLD due to preempt
Jan 12 01:18:59 updated rg_info for RG-1 with failover-cnt 6 state: secondary-hold into ssam. Result = success, error: 0
Jan 12 01:18:59 printing fpc_num h0
Jan 12 01:18:59 extracting node_id 0 slot 0
Jan 12 01:18:59 jsrpd_cluster_mode_fab_has_children Local child active 1 remote child active 1
Jan 12 01:18:59 Updating reth0's state from node1-primary to node0-primary
Jan 12 01:18:59 reth0 jsrpd not ready

Jan 12 01:18:59 printing fpc_num h1
Jan 12 01:18:59 extracting node_id 0 slot 0
Jan 12 01:18:59 jsrpd_cluster_mode_fab_has_children Local child active 1 remote child active 1
Jan 12 10:18:59 Updating reth1's state from node1-primary to node0-primary
Jan 12 10:18:59 reth1 jsrpd not ready

Jan 12 10:19:00 SECONDARY_HOLD->SECONDARY due to back to back failover timer expiry for RG-1
Jan 12 10:19:00 updated rg_info for RG-1 with failover-cnt 6 state: secondary into ssam. Result = success, error: 0
Jan 12 10:19:00  jsrpd_jsrxnle_update_remote_status status 1
Chassis Cluster 障害試験② reth0(ge-0/0/4) ケーブル抜線

以下にて障害試験②の結果を纏めてます。
まずはSRX01のreth0(ge-0/0/4)のケーブル抜線をします。
念の為、「show interfaces ge-0/0/4 terse」にてge-0/0/4がdownしている事を確認しましょう!
test-user@SRX01> show interfaces ge-0/0/4 terse
Interface               Admin Link Proto    Local                 Remote
ge-0/0/4                up    down
ge-0/0/4.0              up    down aenet    --> reth0.0
それではge-0/0/4がdown時のChassis Clusterのステータスを確認しましょう!
「show chassis cluster status」「show chassis cluster interfaces | find Monitoring」「show log jsrpd」コマンドで確認しましょう!
show chassis cluster statusコマンド
以下が実際のログです。
Redundancy groupのnode0がsecondary、node1がprimaryになっている事を確認しましょう!
test-user@SRX01> show chassis cluster status
Monitor Failure codes:
    CS  Cold Sync monitoring        FL  Fabric Connection monitoring
    GR  GRES monitoring             HW  Hardware monitoring
    IF  Interface monitoring        IP  IP monitoring
    LB  Loopback monitoring         MB  Mbuf monitoring
    NH  Nexthop monitoring          NP  NPC monitoring
    SP  SPU monitoring              SM  Schedule monitoring
    CF  Config Sync monitoring      RE  Relinquish monitoring
    IS  IRQ storm

Cluster ID: 1
Node   Priority Status               Preempt Manual   Monitor-failures

Redundancy group: 0 , Failover count: 0
node0  200      primary              no      no       None
node1  1        secondary            no      no       None

Redundancy group: 1 , Failover count: 1
node0  0        secondary            yes     no       IF
node1  1        primary              yes     no       None
show chassis cluster interfaces | find Monitoringコマンド
以下が実際のログです。
ge-0/0/4のステータスがdownしている事を確認しましょう!
test-user@SRX01> show chassis cluster interfaces | find Monitoring
Interface Monitoring:
    Interface         Weight    Status                    Redundancy-group
                                (Physical/Monitored)
    ge-3/0/5          255       Up  /  Up                 1
    ge-3/0/4          255       Up  /  Up                 1
    ge-0/0/5          255       Up  /  Up                 1
    ge-0/0/4          255       Down  /  Down             1
【参考】 show log jsrpd | last 50コマンド
以下が実際のログです。
「show log jsrpdコマンド」にてchassis clusterに関する詳細ログを確認しましょう!
// SRX-01(node0)側
test-user@SRX01> show log jsrpd | last 50 | no-more
Jan 12 10:20:03 ISSU state: 0
Jan 12 10:20:37 printing fpc_num h0
Jan 12 10:20:37 extracting node_id 0 slot 0
Jan 12 10:20:37 jsrpd_cluster_mode_fab_has_children Local child active 1 remote child active 1
Jan 12 10:20:37 reth0 from  jsrpd_ssam_reth_read reth_rg_id=1

Jan 12 10:20:37 Interface ge-0/0/4 is going down
Jan 12 10:20:37 ge-0/0/4 interface monitored by RG-1 changed state from Up to Down
Jan 12 10:20:37 intf failed, computed-weight 0
Jan 12 10:20:37 LED changed from Green to Amber, reason is Monitored objects are down
Jan 12 10:20:37 setting sysctl for ha led color(Amber)
Jan 12 10:20:37 Current threshold for rg-1 is 0. Setting priority to 0. Failures: interface-monitoring
Jan 12 10:20:37 RG-1 PRIMARY->SECONDARY_HOLD since other node has higher priority of 1
Jan 12 10:20:37 Successfully sent an snmp-trap due to a failover from primary to secondary-hold on RG-1 on cluster 1 node 0. Reason: Monitor failed: IF
Jan 12 10:20:37 updated rg_info for RG-1 with failover-cnt 1 state: secondary-hold into ssam. Result = success, error: 0
Jan 12 10:20:37 Successfully sent an snmp-trap due to a failover from primary to secondary-hold on RG-1 on cluster 1 node 0. Reason: Monitor failed: IF
Jan 12 10:20:37 Changing the primary'ship of RG-1 from node0 to node1
Jan 12 10:20:37 reth0 ifd state changed from node0-primary -> node1-primary for RG-1
Jan 12 10:20:37 reth1 ifd state changed from node0-primary -> node1-primary for RG-1
Jan 12 10:20:37 updating primary-node as node1 for RG-1 into ssam. Previous primary was node0. Result = success, Unknown error: 0
Jan 12 10:20:37 printing fpc_num h0
Jan 12 10:20:37 extracting node_id 0 slot 0
Jan 12 10:20:37 jsrpd_cluster_mode_fab_has_children Local child active 1 remote child active 1
Jan 12 10:20:37 reth0 from  jsrpd_ssam_reth_read reth_rg_id=1

Jan 12 10:20:37 printing fpc_num h1
Jan 12 10:20:37 extracting node_id 0 slot 0
Jan 12 10:20:37 jsrpd_cluster_mode_fab_has_children Local child active 1 remote child active 1
Jan 12 10:20:37 reth1 from  jsrpd_ssam_reth_read reth_rg_id=1

Jan 12 10:20:38 SECONDARY_HOLD->SECONDARY due to back to back failover timer expiry for RG-1
Jan 12 10:20:38 Successfully sent an snmp-trap due to a failover from secondary-hold to secondary on RG-1 on cluster 1 node 0. Reason: Ready to become secondary
Jan 12 10:20:38 updated rg_info for RG-1 with failover-cnt 1 state: secondary into ssam. Result = success, error: 0
Jan 12 10:20:38  jsrpd_jsrxnle_update_remote_status status 1
Jan 12 10:20:38 Successfully sent an snmp-trap due to a failover from secondary-hold to secondary on RG-1 on cluster 1 node 0. Reason: Ready to become secondary
// SRX-02(node1)側
test-user@SRX02> show log jsrpd | last 50 | no-more
Jan 12 10:20:37 printing fpc_num h0
Jan 12 10:20:37 extracting node_id 0 slot 0
Jan 12 10:20:37 jsrpd_cluster_mode_fab_has_children Local child active 1 remote child active 1
Jan 12 10:20:37 reth0 jsrpd not ready

Jan 12 10:20:37 printing fpc_num h0
Jan 12 10:20:37 extracting node_id 0 slot 0
Jan 12 10:20:37 jsrpd_cluster_mode_fab_has_children Local child active 1 remote child active 1
Jan 12 10:20:37 reth0 jsrpd not ready

Jan 12 10:20:37 Interface ge-0/0/4 is going down
Jan 12 10:20:37 ge-0/0/4 interface monitored by RG-1 changed state from Up to Down
Jan 12 10:20:37 Current threshold for rg-1 is 255. Failures: none
Jan 12 10:20:37 RG-1 SECONDARY->PRIMARY due to current primary node having 0 priority
Jan 12 10:20:37 entering primary for RG: 1

Jan 12 10:20:37 updated rg_info for RG-1 with failover-cnt 7 state: primary into ssam. Result = success, error: 0
Jan 12 10:20:37 printing fpc_num h0
Jan 12 10:20:37 extracting node_id 0 slot 0
Jan 12 10:20:37 jsrpd_cluster_mode_fab_has_children Local child active 1 remote child active 1
Jan 12 10:20:37 Updating reth0's state from node0-primary to node1-primary
Jan 12 10:20:37 reth0 jsrpd not ready

Jan 12 10:20:37 Interface ge-0/0/4 is going down
Jan 12 10:20:37 printing fpc_num h1
Jan 12 10:20:37 extracting node_id 0 slot 0
Jan 12 10:20:37 jsrpd_cluster_mode_fab_has_children Local child active 1 remote child active 1
Jan 12 10:20:37 Updating reth1's state from node0-primary to node1-primary
Jan 12 10:20:37 reth1 jsrpd not ready

Jan 12 10:20:37 Current threshold for rg-1 is 255. Failures: none
Chassis Cluster 障害試験③ fabric link(ge-0/0/3) ケーブル抜線

以下にて障害試験③の結果を纏めてます。
まずはSRX01のfabric link(ge-0/0/3) のケーブル抜線をします。
念の為、「show interfaces ge-0/0/3 terse」にてge-0/0/3がdownしている事を確認しましょう!
test-user@SRX01> show interfaces ge-0/0/3 terse
Interface               Admin Link Proto    Local                 Remote
ge-0/0/3                up    down
ge-0/0/3.0              up    down aenet    --> fab0.0
それではge-0/0/3がdown時のChassis Clusterのステータスを確認しましょう!
「show chassis cluster status」「show chassis cluster interfaces | find Monitoring」「show log jsrpd」コマンドで確認しましょう!
show chassis cluster statusコマンド
以下が実際のログです。
test-user@SRX01> show chassis cluster status
Monitor Failure codes:
    CS  Cold Sync monitoring        FL  Fabric Connection monitoring
    GR  GRES monitoring             HW  Hardware monitoring
    IF  Interface monitoring        IP  IP monitoring
    LB  Loopback monitoring         MB  Mbuf monitoring
    NH  Nexthop monitoring          NP  NPC monitoring
    SP  SPU monitoring              SM  Schedule monitoring
    CF  Config Sync monitoring      RE  Relinquish monitoring
    IS  IRQ storm

Cluster ID: 1
Node   Priority Status               Preempt Manual   Monitor-failures

Redundancy group: 0 , Failover count: 0
node0  200      primary              no      no       None
node1  0        secondary            no      no       FL

Redundancy group: 1 , Failover count: 0
node0  200      primary              yes     no       None
node1  0        ineligible           yes     no       FL
show chassis cluster interfaces | find Fabric コマンド
以下が実際のログです。
Fabric linkステータスがDownであること、ge-0/0/3, ge-3/0/3のステータスがdownしている事を確認しましょう!
test-user@SRX01> show chassis cluster interfaces | find Fabric

Fabric link status: Down

Fabric interfaces:
    Name    Child-interface    Status                    Security
                               (Physical/Monitored)
    fab0    ge-0/0/3           Down / Down               Disabled
    fab0
    fab1    ge-3/0/3           Down / Down               Disabled
    fab1
【参考】 show log jsrpdコマンド
以下が実際のログです。
「show log jsrpdコマンド」にてchassis clusterに関する詳細ログを確認しましょう!
// SRX-01(node0)側
test-user@SRX01> show log jsrpd | last 100 | no-more
Jan 12 10:29:41 Processing link status event
Jan 12 10:29:41 control link up count:1
Jan 12 10:29:41 fabric link up count:0
Jan 12 10:29:41 Received fabrics child link status from PFE
Jan 12 10:29:41 jsrpd_pfe_fabmon_update_lnk_status: lnk_idx:0, link_state(curr:0, new:0)
Jan 12 10:29:41 jsrpd_pfe_fabmon_update_lnk_status: lnk_idx:1, link_state(curr:0, new:0)
Jan 12 10:29:41 jsrpd_pfe_fabmon_update_lnk_status: lnk_idx:2, link_state(curr:0, new:255)
Jan 12 10:29:41 State of lnk-0 of fab1 remains DOWN
Jan 12 10:29:41 jsrpd_pfe_fabmon_update_lnk_status: lnk_idx:3, link_state(curr:0, new:255)
Jan 12 10:29:41 State of lnk-1 of fab1 remains DOWN
Jan 12 10:29:41 HA Fabric Info: After fabric child status is updated
Jan 12 10:29:41   node0: fab0 is Active with 1 child (AggId: 133)
Jan 12 10:29:41   link-0: ge-0/0/3 (0/0/3) is Active : ifd_state: Down pfe_state:Down secure_state Disabled
Jan 12 10:29:41   node1: fab1 is Active with 1 child (AggId: 131)
Jan 12 10:29:41   link-0: ge-3/0/3 (3/0/3) is Active : ifd_state: Down pfe_state:Down secure_state Disabled
Jan 12 10:29:41 control link UP/UP fabric link UP/DOWN
Jan 12 10:29:41 only fabric link is down, delay action (19)
Jan 12 10:29:41 link status timer started, delay=2000
// SRX-02(node1)側
test-user@SRX02> show log jsrpd | last 100 | no-more
Jan 12 10:28:19 Processing link status event
Jan 12 10:28:19 control link up count:1
Jan 12 10:28:19 fabric link up count:0
Jan 12 10:28:19 Received fabrics child link status from PFE
Jan 12 10:28:19 jsrpd_pfe_fabmon_update_lnk_status: lnk_idx:0, link_state(curr:0, new:255)
Jan 12 10:28:19 State of lnk-0 of fab0 remains DOWN
Jan 12 10:28:19 jsrpd_pfe_fabmon_update_lnk_status: lnk_idx:1, link_state(curr:0, new:255)
Jan 12 10:28:19 State of lnk-1 of fab0 remains DOWN
Jan 12 10:28:19 jsrpd_pfe_fabmon_update_lnk_status: lnk_idx:2, link_state(curr:0, new:0)
Jan 12 10:28:19 jsrpd_pfe_fabmon_update_lnk_status: lnk_idx:3, link_state(curr:0, new:0)
Jan 12 10:28:19 HA Fabric Info: After fabric child status is updated
Jan 12 10:28:19   node0: fab0 is Active with 1 child (AggId: 133)
Jan 12 10:28:19   link-0: ge-0/0/3 (0/0/3) is Active : ifd_state: Up pfe_state:Down secure_state Disabled
Jan 12 10:28:19   node1: fab1 is Active with 1 child (AggId: 131)
Jan 12 10:28:19   link-0: ge-3/0/3 (3/0/3) is Active : ifd_state: Up pfe_state:Down secure_state Disabled
Jan 12 10:28:19 control link UP/UP fabric link UP/DOWN
Jan 12 10:28:19 only fabric link is down, delay action (29)
Jan 12 10:28:19 link status timer started, delay=2000
Jan 12 10:28:20 Received Nexthop monitor status
Jan 12 10:28:20 Received nexthop status from PFE 0
Jan 12 10:28:20 Loopback Status:
Jan 12 10:28:20 Index: 0  PFE Id: 0, Error_code: 0x00 -
Jan 12 10:28:20 Received fabric monitor status
Jan 12 10:28:20 Received fabric monitor link status from node1 PFE
Jan 12 10:28:20 lnk_idx:0 name(ge-3/0/3) ifd_state(curr:1, new:1), pfe_state(curr:0, new:1)
Jan 12 10:28:20 State of lnk-0 of fab1 changed from DOWN to UP
Jan 12 10:28:20 lnk_idx:1 name() ifd_state(curr:0, new:0), pfe_state(curr:0, new:0)
Jan 12 10:28:20 Fabric link current state: UP link up count:1
Jan 12 10:28:20 HA Fabric Info: After fabric status is updated
Jan 12 10:28:20   node0: fab0 is Active with 1 child (AggId: 133)
Jan 12 10:28:20   link-0: ge-0/0/3 (0/0/3) is Active : ifd_state: Up pfe_state:Down secure_state Disabled
Jan 12 10:28:20   node1: fab1 is Active with 1 child (AggId: 131)
Jan 12 10:28:20   link-0: ge-3/0/3 (3/0/3) is Active : ifd_state: Up pfe_state:Up secure_state Disabled
Jan 12 10:28:20 jsrpd_pfe_fabmon_status_update: fab child link state change detected
Jan 12 10:28:20 Only RG0 primary can do ssame update nmchassis_is_re_protocol_master :0
Jan 12 10:28:20 processing SIGUSR2 ...
Jan 12 10:28:20 link status timer is already set
Jan 12 10:28:21 HA Fabric Info: Before populated from blob
Jan 12 10:28:21   node0: fab0 is Active with 1 child (AggId: 133)
Jan 12 10:28:21   link-0: ge-0/0/3 (0/0/3) is Active : ifd_state: Up pfe_state:Down secure_state Disabled
Jan 12 10:28:21   node1: fab1 is Active with 1 child (AggId: 131)
Jan 12 10:28:21   link-0: ge-3/0/3 (3/0/3) is Active : ifd_state: Up pfe_state:Up secure_state Disabled
Jan 12 10:28:21 HA Fabric Info: After populated from blob
Jan 12 10:28:21   node0: fab0 is Active with 1 child (AggId: 133)
Jan 12 10:28:21   link-0: ge-0/0/3 (0/0/3) is Active : ifd_state: Up pfe_state:Down secure_state Disabled
Jan 12 10:28:21   node1: fab1 is Active with 1 child (AggId: 131)
Jan 12 10:28:21   link-0: ge-3/0/3 (3/0/3) is Active : ifd_state: Up pfe_state:Up secure_state Disabled
Jan 12 10:28:21 HA Fabric Info: Before populated from blob
Jan 12 10:28:21   node0: fab0 is Active with 1 child (AggId: 133)
Jan 12 10:28:21   link-0: ge-0/0/3 (0/0/3) is Active : ifd_state: Up pfe_state:Down secure_state Disabled
Jan 12 10:28:21   node1: fab1 is Active with 1 child (AggId: 131)
Jan 12 10:28:21   link-0: ge-3/0/3 (3/0/3) is Active : ifd_state: Up pfe_state:Up secure_state Disabled
Jan 12 10:28:21 HA Fabric Info: After populated from blob
Jan 12 10:28:21   node0: fab0 is Active with 1 child (AggId: 133)
Jan 12 10:28:21   link-0: ge-0/0/3 (0/0/3) is Active : ifd_state: Up pfe_state:Up secure_state Disabled
Jan 12 10:28:21   node1: fab1 is Active with 1 child (AggId: 131)
Jan 12 10:28:21   link-0: ge-3/0/3 (3/0/3) is Active : ifd_state: Up pfe_state:Up secure_state Disabled
Chassis Cluster 障害試験④ control link(ge-0/0/1) ケーブル抜線
以下にて障害試験④の結果を纏めてます。
まずはSRX01のcontrol link(ge-0/0/1) のケーブル抜線をします。
念の為、「show interfaces ge-0/0/1 terse」にてge-0/0/1がdownしている事を確認しましょう!
test-user@SRX01> show interfaces ge-0/0/1 terse
Interface               Admin Link Proto    Local                 Remote
ge-0/0/1                up    down
それではge-0/0/1がdown時のChassis Clusterのステータスを確認しましょう!
「show chassis cluster status」「show log jsrpd」コマンドで確認しましょう!
show chassis cluster statusコマンド
以下が実際のログです。
node1が「Lost」になっている事を確認しましょう!
test-user@SRX01> show chassis cluster status
Monitor Failure codes:
    CS  Cold Sync monitoring        FL  Fabric Connection monitoring
    GR  GRES monitoring             HW  Hardware monitoring
    IF  Interface monitoring        IP  IP monitoring
    LB  Loopback monitoring         MB  Mbuf monitoring
    NH  Nexthop monitoring          NP  NPC monitoring
    SP  SPU monitoring              SM  Schedule monitoring
    CF  Config Sync monitoring      RE  Relinquish monitoring
    IS  IRQ storm

Cluster ID: 1
Node   Priority Status               Preempt Manual   Monitor-failures

Redundancy group: 0 , Failover count: 0
node0  200      primary              no      no       None
node1  0        lost                 n/a     n/a      n/a

Redundancy group: 1 , Failover count: 0
node0  200      primary              yes     no       None
node1  0        lost                 n/a     n/a      n/a
【参考】 show log jsrpdコマンド
以下が実際のログです。
「show log jsrpdコマンド」にてchassis clusterに関する詳細ログを確認しましょう!
// SRX-01(node0)側
test-user@SRX01> show log jsrpd | last 50 | no-more
Jan 12 10:40:34 Successfully sent jnxJsChClusterIntfTrap trap with severity minor to inform that Control link -  fxp1 state changed from UP to DOWN on cluster 1; reason: missed heartbeats
Jan 12 10:40:34 printing fpc_num 0
Jan 12 10:40:34 extracting node_id 0 slot 0
Jan 12 10:40:34 jsrpd_cluster_mode_fab_has_children Local child active 1 remote child active 1
Jan 12 10:40:34 Interface ge-0/0/1 is going down
Jan 12 10:40:34 processing SIGUSR2 ...
Jan 12 10:40:34 link status timer started, delay=1000
Jan 12 10:40:34 TCP-S: TCP read error (Operation timed out)
Jan 12 10:40:34 TCP-S: TCP timeout error close
Jan 12 10:40:35 Processing link status event
Jan 12 10:40:35 control link up count:0
Jan 12 10:40:35 fabric link up count:1
Jan 12 10:40:35 Received fabrics child link status from PFE
Jan 12 10:40:35 jsrpd_pfe_fabmon_update_lnk_status: lnk_idx:0, link_state(curr:1, new:1)
Jan 12 10:40:35 jsrpd_pfe_fabmon_update_lnk_status: lnk_idx:1, link_state(curr:0, new:0)
Jan 12 10:40:35 jsrpd_pfe_fabmon_update_lnk_status: lnk_idx:2, link_state(curr:1, new:255)
Jan 12 10:40:35 State of lnk-0 of fab1 remains UP
Jan 12 10:40:35 jsrpd_pfe_fabmon_update_lnk_status: lnk_idx:3, link_state(curr:0, new:255)
Jan 12 10:40:35 State of lnk-1 of fab1 remains DOWN
Jan 12 10:40:35 HA Fabric Info: After fabric child status is updated
Jan 12 10:40:35   node0: fab0 is Active with 1 child (AggId: 133)
Jan 12 10:40:35   link-0: ge-0/0/3 (0/0/3) is Active : ifd_state: Up pfe_state:Up secure_state Disabled
Jan 12 10:40:35   node1: fab1 is Active with 1 child (AggId: 131)
Jan 12 10:40:35   link-0: ge-3/0/3 (3/0/3) is Active : ifd_state: Up pfe_state:Up secure_state Disabled
Jan 12 10:40:35 control link UP/DOWN fabric link UP/UP
Jan 12 10:40:35 control link status changed from UP->DOWN
Jan 12 10:40:35 Successfully sent jnxJsChClusterIntfTrap trap with severity major to inform that Control link  0  state changed from UP to DOWN on cluster 1; reason: control link status changed
Jan 12 10:40:35 no change to fabric link status (UP)
Jan 12 10:40:35 Control link recovery qualified : true
Jan 12 10:40:35 Processing control UP->DOWN
Jan 12 10:40:35 RG state is primary, do NOT signal chassisd on peer lost
Jan 12 10:40:35 marking the remote node1 as lost
Jan 12 10:40:35 LED changed from Green to Red, reason is Peer node: node1 is not present
Jan 12 10:40:35 setting sysctl for ha led color(Red)
Jan 12 10:40:35  jsrpd_jsrxnle_update_remote_status status 0
Jan 12 10:40:35 Control link only failure detected  current RG-0 state: primary
Jan 12 10:40:35 Last packet-ids seen before becoming primary control link: 7371 fabric link 0
Jan 12 10:40:37 PFE Rx client is shutdown (socket id: 21, session 786fc0)
// SRX-02(node1)側
test-user@SRX02> show log jsrpd | last 50 | no-more
Jan 12 10:40:34 processing SIGUSR2 ...
Jan 12 10:40:34 link status timer started, delay=1000
Jan 12 10:40:34 TCP-C: received a TCP msg (len:-1)
Jan 12 10:40:34 TCP-C: TCP read error (Operation timed out)
Jan 12 10:40:34 TCP-C: Closing TCP Client (Timeout Close)
Jan 12 10:40:34 TCP-C: Started retry timer
Jan 12 10:40:35 Processing link status event
Jan 12 10:40:35 control link up count:0
Jan 12 10:40:35 fabric link up count:1
Jan 12 10:40:35 Received fabrics child link status from PFE
Jan 12 10:40:35 jsrpd_pfe_fabmon_update_lnk_status: lnk_idx:0, link_state(curr:1, new:255)
Jan 12 10:40:35 State of lnk-0 of fab0 remains UP
Jan 12 10:40:35 jsrpd_pfe_fabmon_update_lnk_status: lnk_idx:1, link_state(curr:0, new:255)
Jan 12 10:40:35 State of lnk-1 of fab0 remains DOWN
Jan 12 10:40:35 jsrpd_pfe_fabmon_update_lnk_status: lnk_idx:2, link_state(curr:1, new:1)
Jan 12 10:40:35 jsrpd_pfe_fabmon_update_lnk_status: lnk_idx:3, link_state(curr:0, new:0)
Jan 12 10:40:35 HA Fabric Info: After fabric child status is updated
Jan 12 10:40:35   node0: fab0 is Active with 1 child (AggId: 133)
Jan 12 10:40:35   link-0: ge-0/0/3 (0/0/3) is Active : ifd_state: Up pfe_state:Up secure_state Disabled
Jan 12 10:40:35   node1: fab1 is Active with 1 child (AggId: 131)
Jan 12 10:40:35   link-0: ge-3/0/3 (3/0/3) is Active : ifd_state: Up pfe_state:Up secure_state Disabled
Jan 12 10:40:35 control link UP/DOWN fabric link UP/UP
Jan 12 10:40:35 control link status changed from UP->DOWN
Jan 12 10:40:35 no change to fabric link status (UP)
Jan 12 10:40:35 Control link recovery qualified : true
Jan 12 10:40:35 Processing control UP->DOWN
Jan 12 10:40:35 RG state is secondary, signal chassisd on peer lost
Jan 12 10:40:35 Signalled /usr/sbin/chassisd (pid 2924) with signal: 28
Jan 12 10:40:35 marking the remote node0 as lost
Jan 12 10:40:35 LED changed from Green to Red, reason is Peer node: node0 is not present
Jan 12 10:40:35 setting sysctl for ha led color(Red)
Jan 12 10:40:35  jsrpd_jsrxnle_update_remote_status status 0
Jan 12 10:40:35 Control link only failure detected  current RG-0 state: secondary
Jan 12 10:40:35 Inelligibility check  primary is node0, this node's state secondary
Jan 12 10:40:35 Notified PFE, node moving to Ineligible state
Jan 12 10:40:35 RG-0 moving to Ineligible
Jan 12 10:40:35 Before going to inelligible, last packet-id on ctrl-link:7376, last packet-id on fabric-link: 0
Jan 12 10:40:35 updated rg_info for RG-0 with failover-cnt 0 state: ineligible into ssam. Result = success, error: 0
Jan 12 10:40:35 RG-1 moving to Ineligible
Jan 12 10:40:35 updated rg_info for RG-1 with failover-cnt 8 state: ineligible into ssam. Result = success, error: 0
Jan 12 10:40:35 TCP Client init complete. Connecting to server: 129.16.0.1/62845
Junosの勉強方法

では最後にJunosの勉強方法について紹介いたします。
Juniper機器は通信プロバイダーなどのミッションクリティカルが環境で多く導入されております。
その為、Junosを勉強すると、大規模なネットワークへ関わるチャンスが増えます!
Junosの勉強は以下の参考書で勉強を進めましょう!!
以下のアマゾンリンクから内容の詳細(価格/評価等)が確認出来ますので、ぜひ確認してみて下さいね!


まとめ

最後までお読み頂きましてありがとうございます。
Juniperに関する記事は以下にまとめております。
ご興味のある方は是非ご覧ください。
>>参考記事: 「[まとめ] Juniper/Junosの検証結果を記事にまとめました!」
>>参考記事: 「業務で役立つshow、clear、requestコマンドを紹介!」